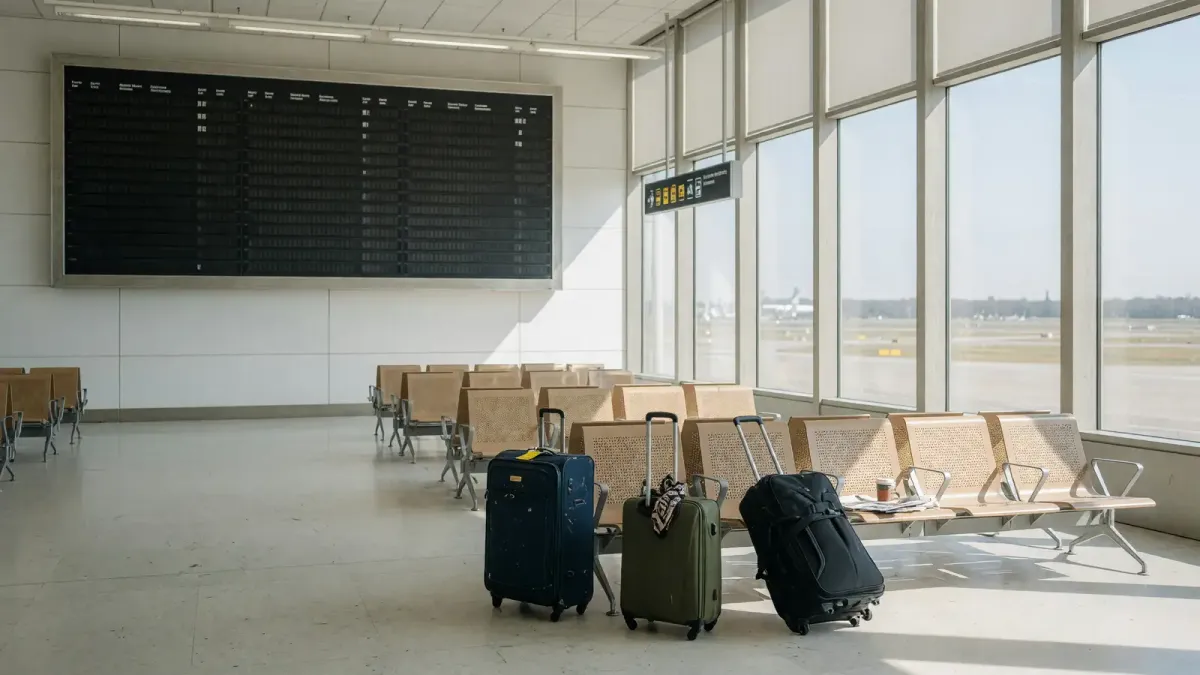
Airfare is still expensive and the planes are still full. The part of the trip that actually got better, according to a survey published this week, is the building you walk through before the gate.
J.D. Power released the 2026 North America Airport Satisfaction Study on September 16, dated from Troy, Michigan. Passenger volume is still sitting at or near the records from 2025. Satisfaction still went up in every size class. That is not a vibe. It is 24,710 surveys.
I am not going to tell you to love O’Hare because a study exists. O’Hare tied Newark at the bottom of the mega list. I am going to tell you what the scores measure, who moved, and what that is worth when you are choosing a connection or deciding whether to show up two hours early.
What they asked, and who they asked
David Slotnick at The Points Guy walked through the method the same day. J.D. Power surveyed 24,710 U.S. or Canadian residents who had used at least one U.S. or Canadian airport in the previous 30 days. Fielding ran from July 2025 through July 2026. Scores sit on a 1,000-point scale.
Airports are split by passenger volume, not by how famous the skyline is. Mega airports handle 33 million or more passengers a year. Large airports sit between 10 million and 32.9 million. Medium airports handle 4.5 million to 9.9 million. If your home field is a regional strip under that floor, it is not in this table. Do not invent a ranking for it.
Business Travel News listed the seven criteria in order of importance: ease of traveling through the airport; level of trust with the airport; terminal facilities; airport staff; the departure and “to airport” experience; food, beverage, and retail; then the arrival and “from airport” experience. Ease of movement is first. The sandwich is sixth. That matches how people actually miss flights.
Nathan Diller at USA Today put the same seven areas in plainer English: getting through, trusting the place, and what the building is like. Michael Taylor, J.D. Power’s managing director of travel, hospitality, and retail, said design and structural choices change how passengers spend time and money in the terminal. That is the study talking, not a food-court press kit.
This is not a TSA report. Screening still sits on its own clock. We already covered how PreCheck water bottles may work by Thanksgiving, or not and what actually speeds up a security line. The J.D. Power number is the rest of the building: wayfinding, bathrooms, whether the concourse feels like a construction site.
The winners, with the actual scores
Minneapolis–Saint Paul International Airport ranked highest among mega airports for a third straight year, at 684. Detroit Metro was second at 663. Phoenix Sky Harbor was third at 642. Those three names have been the top of this bucket for three years. MSP’s score is up from 660 in 2025. Detroit is up from 649. Phoenix is up from 634. The mega-class average is 617, up from 603.
Tampa International Airport took large airports at 715, up from second place last year and 709 points. Portland International Airport jumped from sixth to second at 708, up from 683. Dallas Love Field repeated third at 698, which is actually a drop from 705. Last year’s large-airport winner, John Wayne in Orange County, fell to tenth at 677, down from 730. That is a 53-point slide in one cycle. If you still tell people SNA is the easy Orange County hop because a 2025 list said so, update the list.
Charleston International Airport led medium airports at 712. Business Travel News notes Charleston did not even place in last year’s rankings. Ontario International Airport in California repeated second at 705, slightly down from 709. Indianapolis International Airport, which had led this class for four years, dropped to third at 695 from 713. USA Today adds Milwaukee Mitchell in fourth and Hollywood Burbank in fifth among medium airports.
The average moved in every class: mega airports up 14 points, large up 13, medium up 16. Slotnick flags that 2025 was already a jump from 2024. This is a two-year climb, not a one-year bounce.
The bottom of each bucket
LiveNOW from FOX published the bottom three in each class on September 18, citing the same study.
Worst mega: Chicago O’Hare, Newark Liberty, Denver. Business Travel News says O’Hare and Newark tied for last among mega airports at 585. Newark had been last the prior two years; the score is up from 565, which is progress that still leaves you in last place. Denver is in the FOX bottom three. I do not have a published Denver point total in the extracts, so I am not inventing one.
Worst large: Philadelphia, Honolulu, St. Louis Lambert. Philadelphia was last in this class at 596. It was also last the two prior years. The score is up from 570. Same story as Newark: better, still last.
Worst medium: Cleveland Hopkins, Omaha’s Eppley, Bradley in Windsor Locks, Connecticut. Cleveland was last at 597, down from 611. The medium average rose to 672 from 656. Cleveland moved the wrong way while the class moved up.
If you live in one of those cities, this is not a personality test. It is a reason to add buffer, pick a different connecting hub when the fare is similar, or treat the terminal as a place you leave rather than a place you shop.
Why the scores rose while the flights are still packed
The press release’s own sentence is crowded terminals and packed flights are a bad recipe, and airports still posted higher scores because capital projects finally finished. Slotnick’s version: new terminals, expansions, runway repairs, fewer delays.
Taylor, in the FOX write-up of the news release: for most of the last decade nearly every airport, from the biggest hubs to midsized fields, ran a significant capital project aimed at passenger flow, food and beverage, and the overall experience. “On the whole, those efforts are finally starting to pay off.”
Food, beverage, and retail programs improved eight points year over year across all segments. J.D. Power says local food brands helped, then immediately warns airports still need national chains for people who want the thing they already know. That is a boring and true sentence. Travelers do not all want a chef’s counter. Some of them want the same coffee they drink on Tuesday in Des Moines.
None of this says security got faster. The study’s first factor is ease of movement through the airport. A finished concourse can raise that score even if the checkpoint is still a cattle chute. If your pain is specifically TSA, use the PreCheck piece and ignore the F&B paragraph.
What a “perfect” trip spends
Business Travel News carried the spending split. Passengers who rate the airport experience as “perfect” spend an average of $47.60 in the terminal. Passengers who rate it “just OK” spend $20.22 less, which is $27.38 if you do the subtraction. Perfect is rare: 12 percent of journeys.
Airports read that as a revenue slide. You should read it as a warning. A building that feels easy extracts more money from you. If you are trying to keep a trip cheap, a high-scoring airport is not a free lounge. It is a nicer hallway with better bakeries. Set a cap before you clear security, the same way you would in a food hall you did not plan to visit.
The October 19 DOT delay-amenities rule is a separate clock. If your flight is late enough to trigger a hotel voucher, the category on the delay matters. A pretty terminal does not change the voucher. It might change whether you still have the energy to fight for it.
How to use a ranking on a real ticket
Use size class, not a blended “best airports in America” graphic. Tampa at 715 is not beating MSP at 684 in the same race. Tampa is winning large. MSP is winning mega. Mixing those lists is how people end up shocked that a 30-million-passenger hub feels worse than Charleston.
If you can choose a connecting airport, prefer the one that scored in the top three of its class when the layover is long enough to notice the building. MSP, Detroit, Phoenix, Tampa, Portland, Dallas Love, Charleston, Ontario, Indianapolis. That is the useful shortlist from this cycle. John Wayne dropped off it.
If you are stuck with O’Hare, Newark, Philadelphia, or Cleveland, add time. Not “mindfulness.” Time. A 45-minute connection that looked fine on a map is how people write angry surveys.
If you are originating at a winner, do not get cute with arrival. MSP can score 684 and still wreck you if you show up 40 minutes before boarding on a Monday in July. The study’s own TSA footnote cites 18.7 million air travelers over the Fourth of July holiday in 2026. Volume is not theoretical.
Construction is the reason scores rose. Construction is also why a 2024 memory of an airport is stale. Indianapolis fell. Charleston appeared. Portland jumped. Re-check the airport you think you know before you sell a connection to a relative.
I would not pick a fare solely because Charleston won medium airports. I would pick Charleston over a similar fare through Cleveland if I had a two-hour layover and a kid. That is the whole practical use of a 1,000-point study.
The survey closed in July 2026. Anything your airport opened in August is not in these numbers yet. Treat the list as last season’s box score, not a live map.
One more booking habit worth killing: do not pick a connecting airport because it “used to be easy.” Indianapolis led the medium class for four years and then lost 18 points. Dallas Love Field stayed third and still lost 7. Philadelphia improved 26 points and remained last in large. The direction of the score and the rank are different facts. Rank tells you who beat whom this cycle. The point total tells you whether the building actually moved.
If you are flying a mega hub because that is where the long-haul bank is, the average of 617 is the weather, not the forecast for your Tuesday. MSP at 684 is 67 points above that average. O’Hare and Newark at 585 are 32 below it. That gap is the difference between a connection you can spend in a chair and a connection you spend on a shuttle between terminals you cannot name. Budget the shuttle. The study will not ride it for you.

Discussion
Comments
Share a helpful tip, question, or takeaway from MSP Won Airport Satisfaction Again. O'Hare Tied Newark at the Bottom.
0 Comments
Loading comments…